Quality Risk Management in the Pharma – View 8 QRM Tools
By: Gerry Creaner B.Chem Eng and Donagh Fitzgerald B.Prod Eng. Last Updated: July 2024
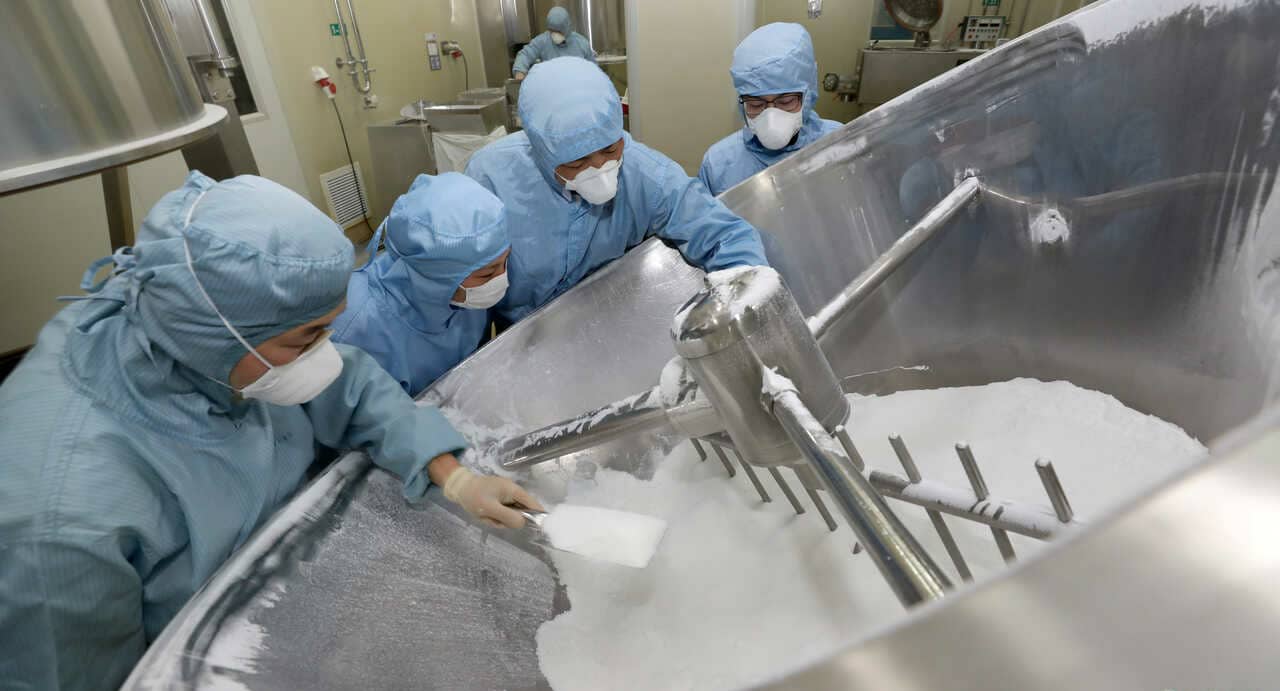
Quality Risk Management (QRM) in the pharmaceutical manufacturing industry is a methodology that makes extensive use of worst-case scenario planning to identify potential risks in advance and develop steps to mitigate those risks. The main objective of QRM is to ensure the quality of pharmaceutical products is maintained throughout the drug product’s lifecycle while balancing risks and benefits.
Think of it as a way of visualizing catastrophe before it happens and coming up with preventive steps either by designing out the problem (preferred) or adding a procedure to mitigate the risk (last resort).
More technically, Quality Risk Management (QRM) is defined by the International Conference of Harmonisation (ICH) as a systematic process for the assessment, control and review of risks to the quality of the drug or medicinal product across the product life cycle.
Why do we need Quality Risk Management?
When developing, manufacturing, testing, and distributing new pharmaceutical or medical device products, or making changes to an existing manufacturing process, you will face risks. Things can and will go wrong, potentially causing harm to the patient.
How do we identify, evaluate, and mitigate these risks that could harm the patient? How can we uncover hidden paths to failure before they occur? Often, it’s not just a single event but a chain of events, where each step leads incrementally closer to failure.
This is why we need Quality Risk Management (QRM). It helps prevent these hidden paths to failure from occurring, ensuring patient safety and product quality.
Quality risk management uses many different risk assessment tools to uncover the underlying chain of events (or causes) that lead to failure and harm to the patient.
Let’s take a look at 8 of the most commonly used:
- Fault Tree Analysis (FTA)
- Cause and Effect (Fishbone Diagram)
- Failure Mode Effect Analysis (FMEA)
- Preliminary Hazard Analysis (PHA)
- Hazard Operability Analysis (HAZOP)
- Event Tree Analysis (ETA)
- Hazard Analysis and Critical Control Points (HACCP)
- The Five Whys
If you’d like to learn how to use these tools, check out our Conversion Course into Pharma for Scientists
1) Fault Tree Analysis (FTA)
This is a graphical tool to explore the causes of system-level failures. It takes a top-down, deductive failure approach. This tool evaluates system (or sub-system) failures one at a time but can combine multiple causes of failure by identifying causal chains.
How it works
It combines a series of lower (component) level events to find out the cause of a top-level event (such as system-level failure.) Typically the approach uses two elements “events” and “logic gates” which connect the events to identify the cause of the top undesired event.
The results are represented pictorially in the form of a tree of fault modes. At each level in the tree, combinations of fault modes are described with logical operators (AND, OR, etc.).
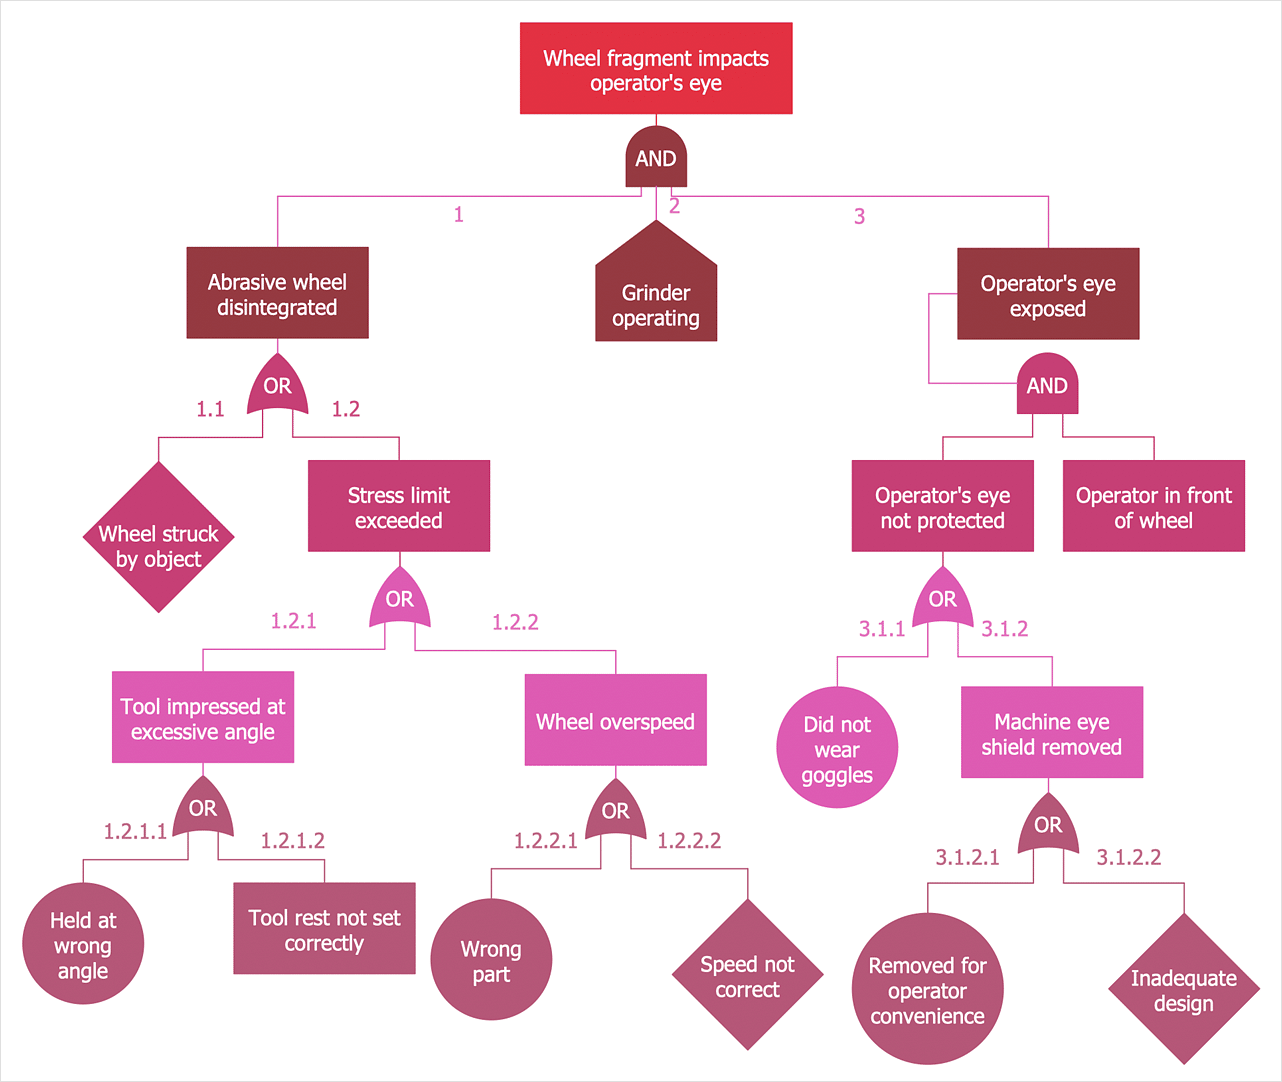
Image: conceptdraw.com
Where it’s used
FTA can be used to investigate complaints or deviations in order to fully understand their root cause and to ensure that intended improvements will fully resolve the issue and not lead to other issues (i.e. solve one problem yet cause a different problem). Fault Tree Analysis is an effective tool for evaluating how multiple factors affect a given issue. The output of an FTA includes a visual representation of failure modes. It is useful both for risk assessment and in developing monitoring programs.
2) Cause and Effect (Fishbone Diagram)
This is also known as an Ishikawa Diagram (named after the Japanese organisational theorist Karou Ishikawa) or a Fishbone Diagram and is used to explore all the potential or real causes (or inputs) that result in a single effect (or output). They associate multiple possible causes with a single effect and are constructed to identify and organize possible causes for the effect. This can help you search for root causes, identify areas where there may be problems, and compare the relative importance of different causes.
How it works
The causal factors (fishbones) attribute to a final outcome (fish head). Causes are arranged according to their level of importance or detail, resulting in a depiction of relationships and a hierarchy of events.
For example:
- Primary branch: represents the effect.
- Major branch: corresponds to a major cause.
- Minor branch: correspond to more detailed causal factors.
Causes are grouped into broad categories. While these categories can be anything, you will often see manpower, methods, materials, machinery (recommended for manufacturing) and equipment, policies, procedures, and people (recommended for administration and service).
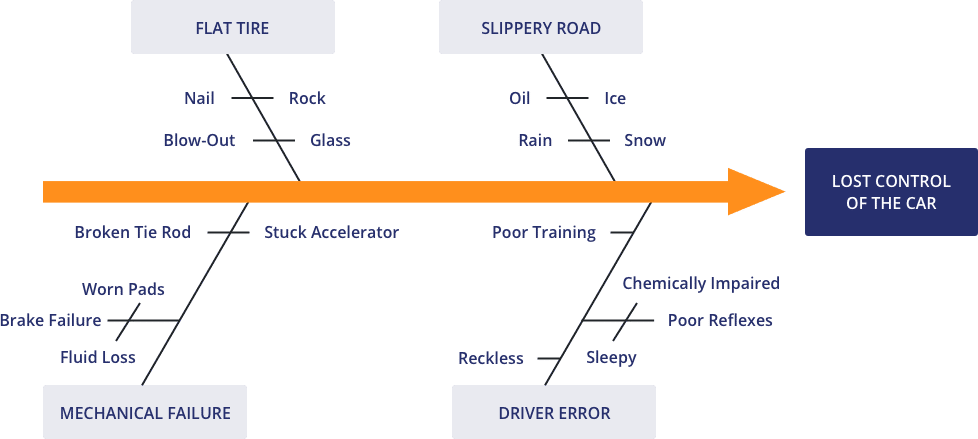
Image: conceptdraw.com
Where it’s used
It’s often used in manufacturing and product development to lay out the different steps in a process, demonstrate where quality control issues might arise, and determine which resources are needed at certain times.
3) Failure Mode Effect Analysis (FMEA)
FMEA provides for an evaluation of potential failure modes for processes and their likely effect on outcomes and/or product performance. It prioritises failures according to how serious their consequences are, how frequently they occur, and how easily they can be detected. Once failure modes are established, risk reduction can be used to eliminate, contain, reduce or control potential failures. FMEA relies on product and process understanding. It also documents current knowledge and actions about the risks of failures, for use in continuous improvement.
How it works
FMEA uses clear assignments of responsibilities and timelines for each action. FMEA methodically breaks down the analysis of complex processes into manageable steps in a table format. It is a powerful tool for summarizing the important modes of (a) failure, factors (b) causing these failures and the likely (c) effects of these failures.
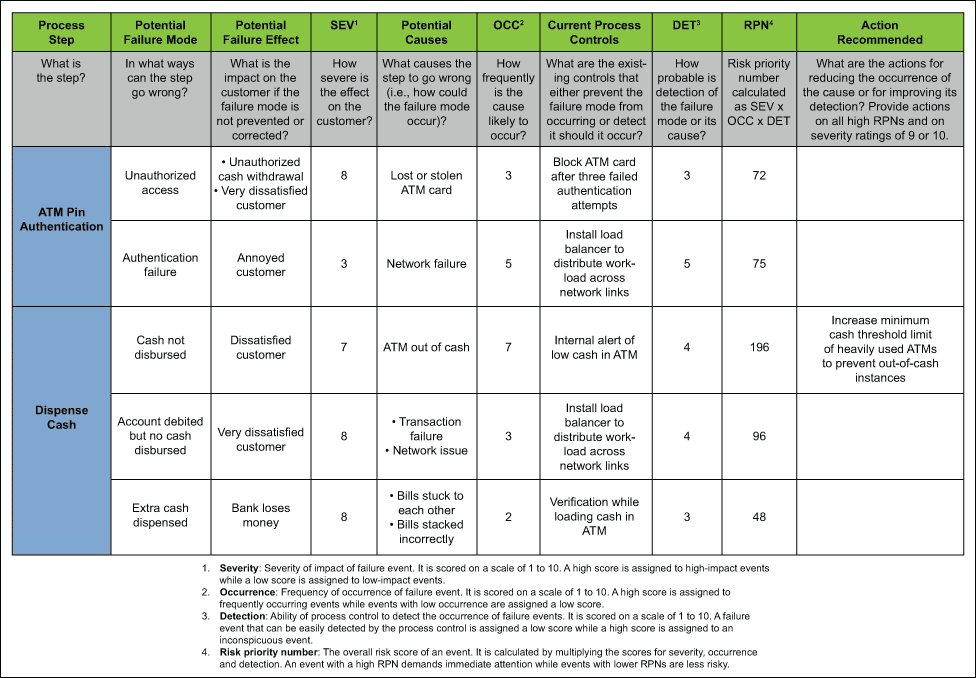
Image: isixsigma.com
Where it’s used
FMEA can be applied to equipment and facilities and might be used to analyze a manufacturing operation and its effect on a product or process. It identifies elements/operations within the system that render it vulnerable. The output/ results of FMEA can be used as a basis for design or further analysis or to guide resource deployment.
Why are FTA or Cause and Effect Diagrams often used together with FMEA?
FTA or Cause and Effect Diagrams are better at identifying possible faults and FMEA is better at analysing the failure modes for faults that have been identified. So in a work environment, they are often used in tandem with each other when looking to identify and solve potential unknown faults for a new system.
However, FMEA is used by itself when a fault has happened and the failure modes that could have caused it needs to be identified to prevent it from happening again.
4) Preliminary Hazard Analysis (PHA)
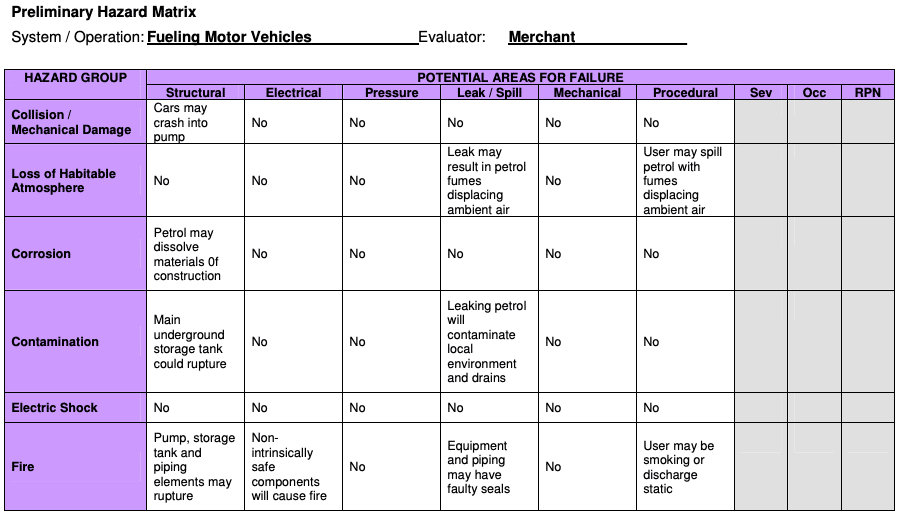
PHA is a tool of analysis based on applying prior experience or knowledge of a hazard or failure to identify future hazards, hazardous situations and events that might cause harm, as well as to estimate their probability of occurrence for a given activity, facility, product or system.
How it works
The tool consists of:
- the identification of the possibilities that the risk event happens
- the qualitative evaluation of the extent of possible injury or damage to health that could result
- a relative ranking of the hazard using a combination of severity and likelihood of occurrence
- the identification of possible remedial measures
Where it’s used
PHA is most commonly used early in the development of a project when there is little information on design details or operating procedures; thus, it will often be a precursor to further studies. It focuses predominantly on identifying and classifying hazards rather than evaluating them in detail. It can be used for product, process and facility design as well as to evaluate the types of hazards for the general product type and the specific product. PHA might be useful where circumstances prevent a more extensive technique from being used. Typically, hazards identified in the PHA require additional follow-up analyses using other tools.
5) Hazard Operability Analysis (HAZOP)
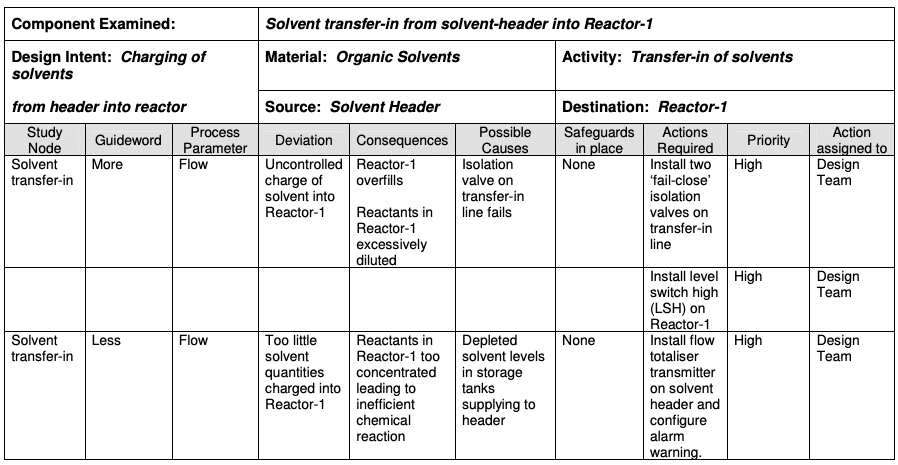
HAZOP is a structured and systematic technique for analysing and assessing the risk posed by a system. It is based on a theory that assumes that risk events are caused by deviations from the design or operating intentions and then investigates how these deviations could create risk for people, equipment and the plant operations.
How it works
It is a systematic brainstorming technique for identifying hazards using so-called “guide words”. “Guide words” (e.g., No, More, Other Than, Part of, etc.) are applied to relevant parameters (e.g., contamination, temperature) to help identify potential deviations from normal use or design intentions. It often uses a team of people with expertise covering the design of the process or product and its application.
Where it’s used
HAZOP can be applied to manufacturing processes, including outsourced production and formulation as well as the upstream suppliers, equipment and facilities for drug substances and drug (medicinal) products. It has also been used primarily in the pharmaceutical industry for evaluating process safety hazards. The output of a HAZOP analysis is a list of critical operations for risk management. This facilitates regular monitoring of critical points in the manufacturing process.
One of the biggest challenges with HAZOP is that it’s very prescriptive. For example, you use the guide words and process parameters such as no flow, less flow, more flow, no temperature, less temperature, more temperature, time, or any of those elements which can make using this risk management tool tiring, mind-numbing, and difficult to get right.
6) Event Tree Analysis (ETA)
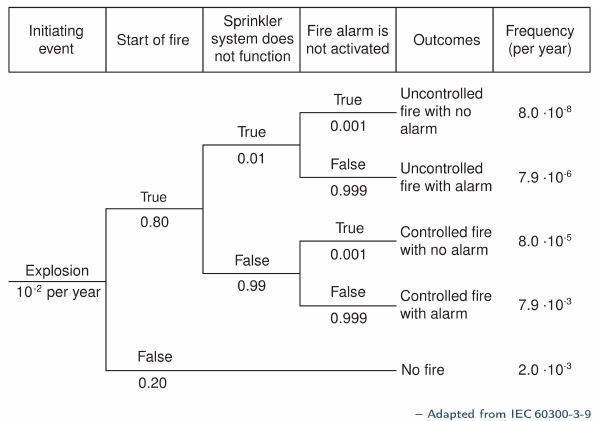
An event tree is a visual representation of all the events which can occur in a system. As the number of events increases, the picture fans out like the branches of a tree.
How it works
The starting point (referred to as the initiating event) disrupts normal system operation. The event tree displays the sequences of events involving the success and/or failure of the system components.
Where it’s used
Event trees can be used to analyze systems in which all components are continuously operating, or for systems in which some or all of the components are in standby mode or those that involve sequential operational logic and switching.
In the case of standby systems and in particular, safety and mission-oriented systems, the event tree is used to identify the various possible outcomes of the system following a given initiating event which is generally an unsatisfactory operating event or situation.
In the case of continuously operating systems, these events can occur (i.e., components can fail) in any arbitrary order. In the event tree analysis, the components can be considered in any order since they do not operate chronologically with respect to each other.
7) Hazard Analysis and Critical Control Points (HACCP)
HACCP is a systematic, proactive, and preventive tool for assuring product quality, reliability, and safety. It is a structured approach that applies technical and scientific principles to analyze, evaluate, prevent, and control the risk or adverse consequence(s) of hazard(s) due to the design, development, production, and use of products. HACCP focuses on the prevention of problems rather than discovering or inspecting problems after-the-fact.
The roots of HACCP go back to the early years of the U.S. space program where food safety was an extreme responsibility for those preparing the foods for use in orbit.
How it works
HACCP consists of the following seven steps:
- conduct a hazard analysis and identify preventive measures for each step of the process; determine the critical control points
- establish critical limits
- establish a system to monitor the critical control points
- establish the corrective action to be taken when monitoring indicates that the critical control points are not in a state of control
- establish a system to verify that the HACCP system is working effectively
- establish a record-keeping system.
HACCP is not simply a set of seven independent principles; each must build on the other. The output of a HACCP analysis is risk management information that facilitates monitoring of critical points not only in the manufacturing process but also in other life cycle phases.
Where it’s used
HACCP is used to identify and manage risks associated with physical, chemical and biological hazards (including microbiological contamination). HACCP is most useful when product and process understanding is sufficiently comprehensive to support the identification of critical control points.
8) The Five Whys
The Five Whys technique is a simple, iterative, and team-driven process that aims to uncover the root cause of a problem or defect by interrogating the issue by asking ‘Why?’ five times. And then implement a preventive measure to prevent the problem from recurring.
The technique was developed by Sakichi Toyoda, the Japanese industrialist, inventor, and founder of Toyota Industries. It became popular as the Toyota Production System (TPS) and the basis of lean manufacturing became the dominant paradigm for manufacturing worldwide.
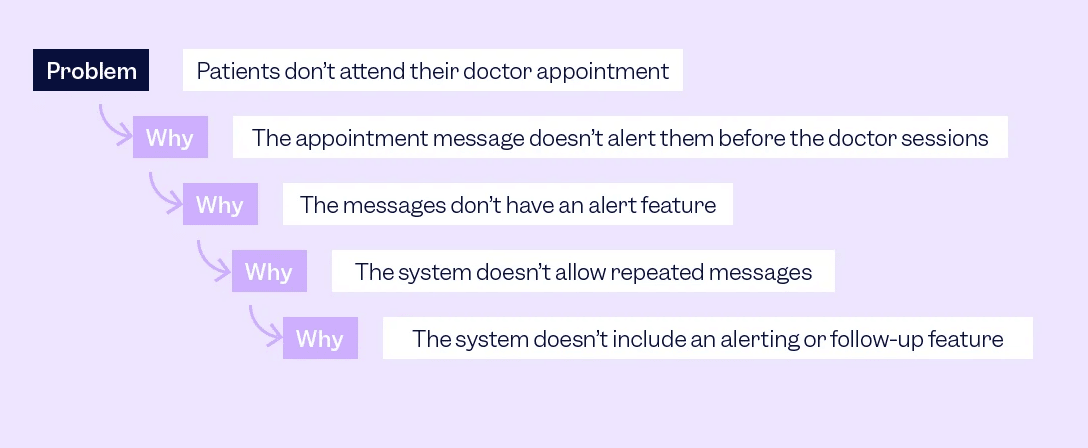
Image: scilife.io
How it works
On the surface, the method is remarkably simple. When a problem occurs, you drill down to its root cause by asking “Why?” 5 times. Each answer forms the basis of the next question, and the final ‘why?’. By then, a preventive measure should have becomes apparent. Then you follow through with it to prevent the issue from recurring.
Where it’s used
This technique is ideal for troubleshooting or resolving simple or moderately difficult, quality improvement and problems. It’s not so suitable if you need to tackle a complex or critical problem because it can lead you to pursue a single track, or a limited number of tracks, of inquiry when, in fact, there could be multiple causes.
Further Reading
This is the first is a series of posts about Validation in the pharmaceutical industry.
You might also be interested in:
- What is process validation?
- What is an equipment validation protocol?
- What is a Validation Master Plan?
- The 8 most “in demand” skills for validation roles
- What is computer system validation or CSV?
About the Author
Gerry Creaner
President
Senior Lecturer with GetReskilled
Gerry Creaner has over 40-years of experience in the Life Sciences Manufacturing industry across a range of technical, managerial and business roles. He established a very successful engineering consultancy prior to founding GetReskilled, an online education and learning business, with offices in Singapore, Ireland and Boston (USA), focussed on the manufacture of safe and effective medicines for the public.
He is also a founding Director of two Singapore based philanthropic organizations, the Farmleigh Fellowship and the Singapore-Ireland Fund, both of which deepen the well established and historical Singapore – Ireland relationship and deliver long-term benefits to both countries.
Gerry has an undergraduate degree in Chemical Engineering (UCD, 1980) and an MSc (Management) from Trinity College Dublin (2003) and is currently doing research for his Ph.D.
Donagh Fitzgerald
Head of Marketing & Product Development
Mechanical/Production Engineer
Donagh looks after the marketing and product development including the training and pedagogical elements of our programs and makes sure that all GetReskilled’s users can have a great online learning experience. Donagh has lived and worked in many countries including Ireland, America, the UK, Singapore, Hong Kong and Japan. Donagh has also served as the Program Manager for the Farmleigh Fellowship based out of Singapore.
Donagh holds Degrees in Production Engineering and Mechanical Engineering from South East Technological University, Ireland.

